


Navigating Maps
Browsing Hierarchies
Browsing Networks
Semantic Networks
Other Representations


Home > Archive > Developers/reference > Background > Other Representations
![]()
Many other techniques have been proposed to demonstrate such structures more effectively. Sophisticated visualization methods are used to improve the efficiency and aesthetic qualities of such diagrams, both in 2D and 3D space. These include the approaches implemented in hyperbolic space and the radial tree, which is a special version of the hyperbolic tree. These methods effectively address the drawbacks of the Euclidean, concentric circles model. Examples include:
![]()
As its name implies, a TreeMap (Bederson et al., 2002) (Figure 9) is a diagram for representing hierarchical structures. A TreeMap displays the hierarchy as a series of embedded boxes, where each box contains its children, usually by alternating vertical and horizontal layers. The relative size of each box can be made proportional to a property, where the parent’s property is the sum of the children. For instance, in a hierarchical file system, file size can be represented by the size of the leaf nodes, and each folder or directory is the size that is the sum of the size of the files within it.
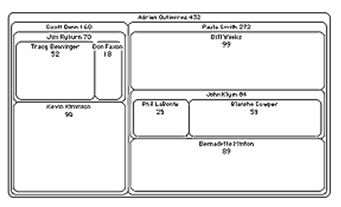
Figure 9. A TreeMap displays the hierarchy as a series of boxes.
![]()
There is ongoing research into an alternative to radial trees, namely arc trees (Neumann, 2004). Arc trees are a novel way of visualizing hierarchical and non-hierarchical relations within one interactive visualization. Arc trees utilize a concept similar to tree maps in presenting hierarchical relationships, in that they fold subtopics’ rectangles into those of main topics (Figure 10). The difference is that tree maps use two- or three-dimensional space to draw and layout rectangles, while arc trees use one linear dimension. The other dimension is utilized to present additional, supplementary links and relations using arcs. Different colored rectangles are employed to denote the parent-child relation of topics, and are usually colored in shades of the main topic’s color. Arcs of different heights, colors, and thicknesses are then used to represent different link types, subtypes, or kinds of relations.
Logical minds find arc trees easy to understand because they are ideal to denote, read, and trace complex relations and subjects. However, they are not intuitive and so are difficult to understand by most users. In addition, by using only one dimension, arc trees tend to grow lengthy and cumbersome when the number of nodes grows too large.
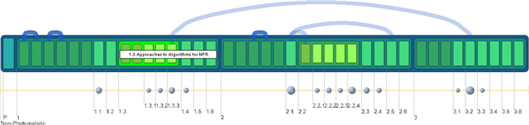
Figure 10. Arc trees, an alternative to radial trees, fold subtopics rectangles into those of main topics, much like treemaps.
![]()
The Cone tree (Robertson et al., 1991) (Figure 11) is a way of displaying hierarchical data (such as organizational charts or directory structures) in three dimensions. Branches from any node are spread out in a cone. This allows a layout that is denser than traditional 2D diagrams, though nodes may be obscured. The Cone Tree technology was further developed commercially by Inxight, spun off from Xerox PARC in 1997, and partially implemented as part of Inxight’s concrete hyperbolic tree implementation, StarTree (Inxight Software) (Figure 7).
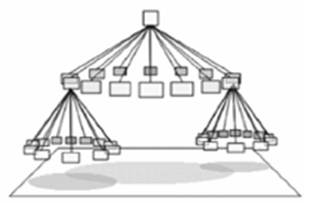
Figure 11. The Xerox PARC Cone tree displays hierarchical data in three dimensions.
A very natural method of tree visualization was developed in Eindhoven’s University of Technology (Figure 12). Its authors observed the arrangement of branches and leaves in a botanical tree and noted how we can easily perceive them, despite the large number of elements depicted. This method is used to convert an abstract tree into a geometric model of a botanical tree and can, for example, be easily applied to the visualization of directory structures.
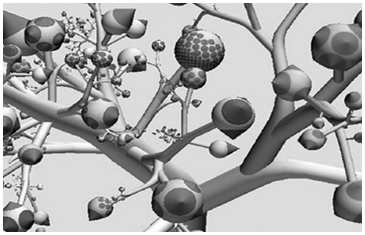
Figure 12. Tree visualization developed by Eindhoven’s University of Technology
![]()
Other navigational aides can augment the use of a radial tree. Full text searching can find content within a node, or fuzzy searching can match commonly misspelled words or phonetic misspellings. Breadcrumbs can delineate a user’s path back home, as with a route map (e.g. Home > Fruit > Sweet > Apples). Colors can group the nodes, either by topic or by their distance from the center.

