
Home > Archive > Developers/reference > Background
![]()
![]()
Radial maps have been explored in various formats for over a century. Several examples of radial maps and network visualization created by other researchers and companies are shown in Figure 3, while a number of applications that focus on interactive information visualization are discussed in Other Projects.
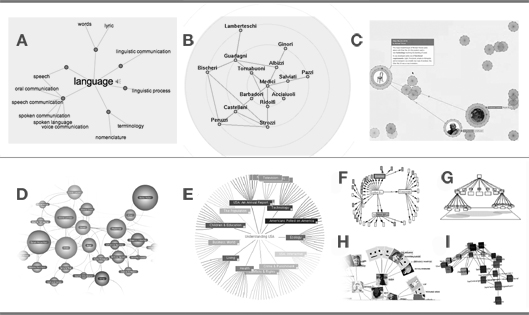
Figure 3. Related work on 2-D radial graph and network visualizations. A. Visual Thesaurus. B. Animated Exploration of Dynamic Graphs with Radial Layout. Yee, Fisher, Dhamija, Hearst. C. Jellyfish. Carolyn Horn & Brian Lucid. Dynamic Media Institute. D. LivePlasma’s music browser. E. StarTree by Inxight Software hyperbolic browser. F. IBM Mapuccino (Webcutter), a Java-based application that allowed multiple views of a Web map G. Xerox PARC Cone tree displays 3D hierarchical data. H. Flickr Graph uses an attraction-repulsion algorithm to display social relationships. I. Navigation View Builder.
This section provides a short history of the foundation upon which SpicyNodes is built, and highlights key recent research by various independent researchers worldwide.

